reposense / reposense Goto Github PK
View Code? Open in Web Editor NEWContribution analysis tool for Git repositories
Home Page: https://reposense.org
License: MIT License
Contribution analysis tool for Git repositories
Home Page: https://reposense.org
License: MIT License

The first space should be smaller than the second one.

This one is attracting more attention than it should. Smaller, less conspicuous icon?
Things to try:
vs
As underscore is allowed in repo and org names, it makes more sense to use org/repo format than org_repo format.

These 4 appear the same size but the LoC of them are vastly different. The size is proportional to what? LoC or something else?

In the current implementation, I used Github ID as the unique identifier, which means that students have to set their author name in local .gitconfig to their Github ID.
After asking a few of my friends and observation from dogfood test, it seems that most of the students prefer to customize their author name, and are reluctant to change it to their Github ID. However, they are okay with setting their local author EMAIL to their Github email. In fact, most of them seem to do so already.
It is better if we check for both author email and name in analyzer, and see match whichever we can. (Need to check whether its possible, if not possible, matching email is still a better solution than matching Github ID)

Red lines can be moved closer to the main bar.
Names can be as small as font size of code (but can show in bold)
May be easier to bookmark if the url is copied to the URL bar rather than clipboard (or both)? Not sure about this though.
e.g., https://harryggg.github.io/index.html?search=f11B3&interval=daily
That way, tutors can create a filter for their teams (and the view they want to see) and bookmark it.
Doing an OR search will allow tutors to filter all their teams e.g., F09-B4 F09-B3 should show both teams rather than no teams
When this is being used for real, I expect we need to update the report at least daily. It would be nice if there is a way to automate that. Minimally a script that we can run manually (or schedule using the OS).
Currently, we use a grey background to indicate lines written by the student, which makes those lines harder to read. Perhaps we should grey out the rest of the lines instead?
It's good if we can have a cli equivalent.
e.g.,
gitgrader --config repos.csv --output ./output
Adding a little padding on the right (similar to left) makes it easier on the eye. Otherwise it looks like part of the chart is hidden.

The visualization reminds me of sail boats. Perhaps we can refer to the chart as the 'sail boats' chart. :-p

It would be useful to see the total time taken after running the CLI command.
We can name it 'Consistency'. Low consistency means high variance.
We can show a table of stats e.g.,
| File | LoC modified | % of file modified |
|---|---|---|
a/b/c/Tag.java |
5 | 12% |
a/b/c/List.java |
15 | 100% |
Or this info can be in the panel heading of each file so that you can see a summary by collapsing all panels.
We can compact some more, in these areas:

The font size used for the name can be smaller too.
It can be useful to be able to expand/collapse all code panels

Details shown on the code panel can be same as the details shown in the name list on the left, for easier matching. But it is ok to show the github username in addition.
Use something other than grey? light yellow for example?

CommandRunner has trouble processing file name with spaces. Need to add escape character. Note: Windows and UNIX have different escape characters.
Some of the files in the repo are still named as gitgrader
Can post a screenshot of ramp chart that uses only one color for all ramps, e.g., red?

Alternatively, you can use a ❌ icon at the right corner.
As the code can take some time to load, it may be better to show a spinner or loading ... while the code is being loaded.
I'm not sure if we should include the start/end dates in the bookmark URL. The dates are likely to change as the page is updated regularly while the bookmark should remain fixed over the semester.
If I change the sorting/grouping, the highlighted author is incorrect.


The current version doesn't look clickable. i.e., mouse icon doesn't change when hovering over.
Also, we can add a small icon to the end of the name to give a target for the user to click.
- CS2103JAN2018-W10-B4/main/NG JU...N WEI
▶️
Are we showing authors who don't have any contributions? If not, we should, as those are the cases that need tutor attention.
In the daily view of the chart, the tooltip is shown as day1 to day2. We can show only one date instead.
On a related note, these dates/times are based on what time zone?
Steps:
Expected: load the code of that person
Actual: nothing happens
OS: Windows 10
At ac9ac8d
analyzer.FileAnalyzerTest > allFileTest FAILED
java.lang.AssertionError at FileAnalyzerTest.java:26
I'd rather not have 'Grader' in the name as the tool doesn't do any grading, plus grading has negative connotations. No idea for a better name though. Some of the good names seems to have been taken already.
Suggestions:

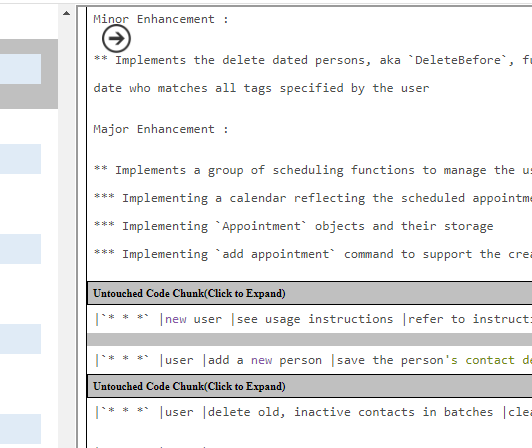
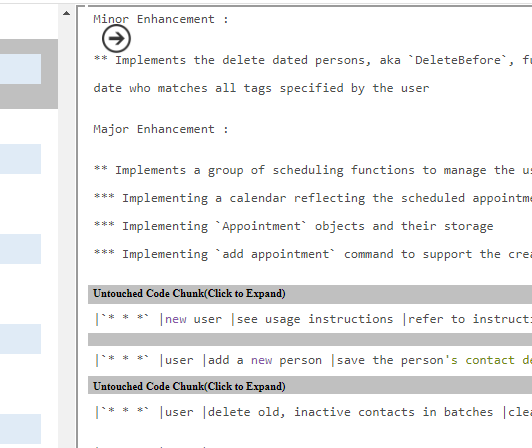
Similar to how GitHub does it, we can show top and bottom n lines of the untouched-code to provide context for the touched-code. That also means collapse only chunks that are longer than 2n.
This can save vertical space

You can also shorten/remove some of the labels to save space. e.g.,
Time interval: [daily] Start date: [] End date: [] can be period: [ ] - [ ] (daily)
It would be useful for the tool to spit out the collated code as one file per person (similar to the collate tool) so that this tool completely replaces collate.
Minor issue but best to fix as this is seen by user.


I thought there should be some ramps for this guy?
I have problem analyzing one specific repo when I run the app in Windows, in UNIX this problem doesnt appear.
https://github.com/CS2103AUG2017-W09-B4/main
^ this is the repo.
When I run Git Clone on this repo, the program will hang. When I run Git Clone on this repo in my Windows PowerShell, it hangs too...:(
@damithc May I ask whether you are able to run the app on your Windows machine?

Collapsed chunks should not attract too much attention
Things to try:
← · · · →
When used for grading, it is also useful to sort by repo, student name
The format used in the CLI command is dd/mm/yyyy. We should use the same format in the report.

In some projects/courses, students work on multiple repos. It is nice to be able to aggregate activities of a student on multiple repos in one chart.
Note: this feature is unlikely to be in v1, but keep this in mind when making architectural decisions.
This part can be tidied/polished up to make a good first impression. Also, may want to optimize the layout like a nav bar at the top of the page (to save vertical space).

We can reduce the scrolling needed if there is a way to collapse code segments that are not touched by the author, for example, similar to how GitHub diff view does it.

If you number the student list, it is easier to see how many students are being shown in the report.
When grouped by team, do you sort based on a total value for the whole team?
It's more accurate to say sort by Repo ?
A declarative, efficient, and flexible JavaScript library for building user interfaces.
🖖 Vue.js is a progressive, incrementally-adoptable JavaScript framework for building UI on the web.
TypeScript is a superset of JavaScript that compiles to clean JavaScript output.
An Open Source Machine Learning Framework for Everyone
The Web framework for perfectionists with deadlines.
A PHP framework for web artisans
Bring data to life with SVG, Canvas and HTML. 📊📈🎉
JavaScript (JS) is a lightweight interpreted programming language with first-class functions.
Some thing interesting about web. New door for the world.
A server is a program made to process requests and deliver data to clients.
Machine learning is a way of modeling and interpreting data that allows a piece of software to respond intelligently.
Some thing interesting about visualization, use data art
Some thing interesting about game, make everyone happy.
We are working to build community through open source technology. NB: members must have two-factor auth.
Open source projects and samples from Microsoft.
Google ❤️ Open Source for everyone.
Alibaba Open Source for everyone
Data-Driven Documents codes.
China tencent open source team.